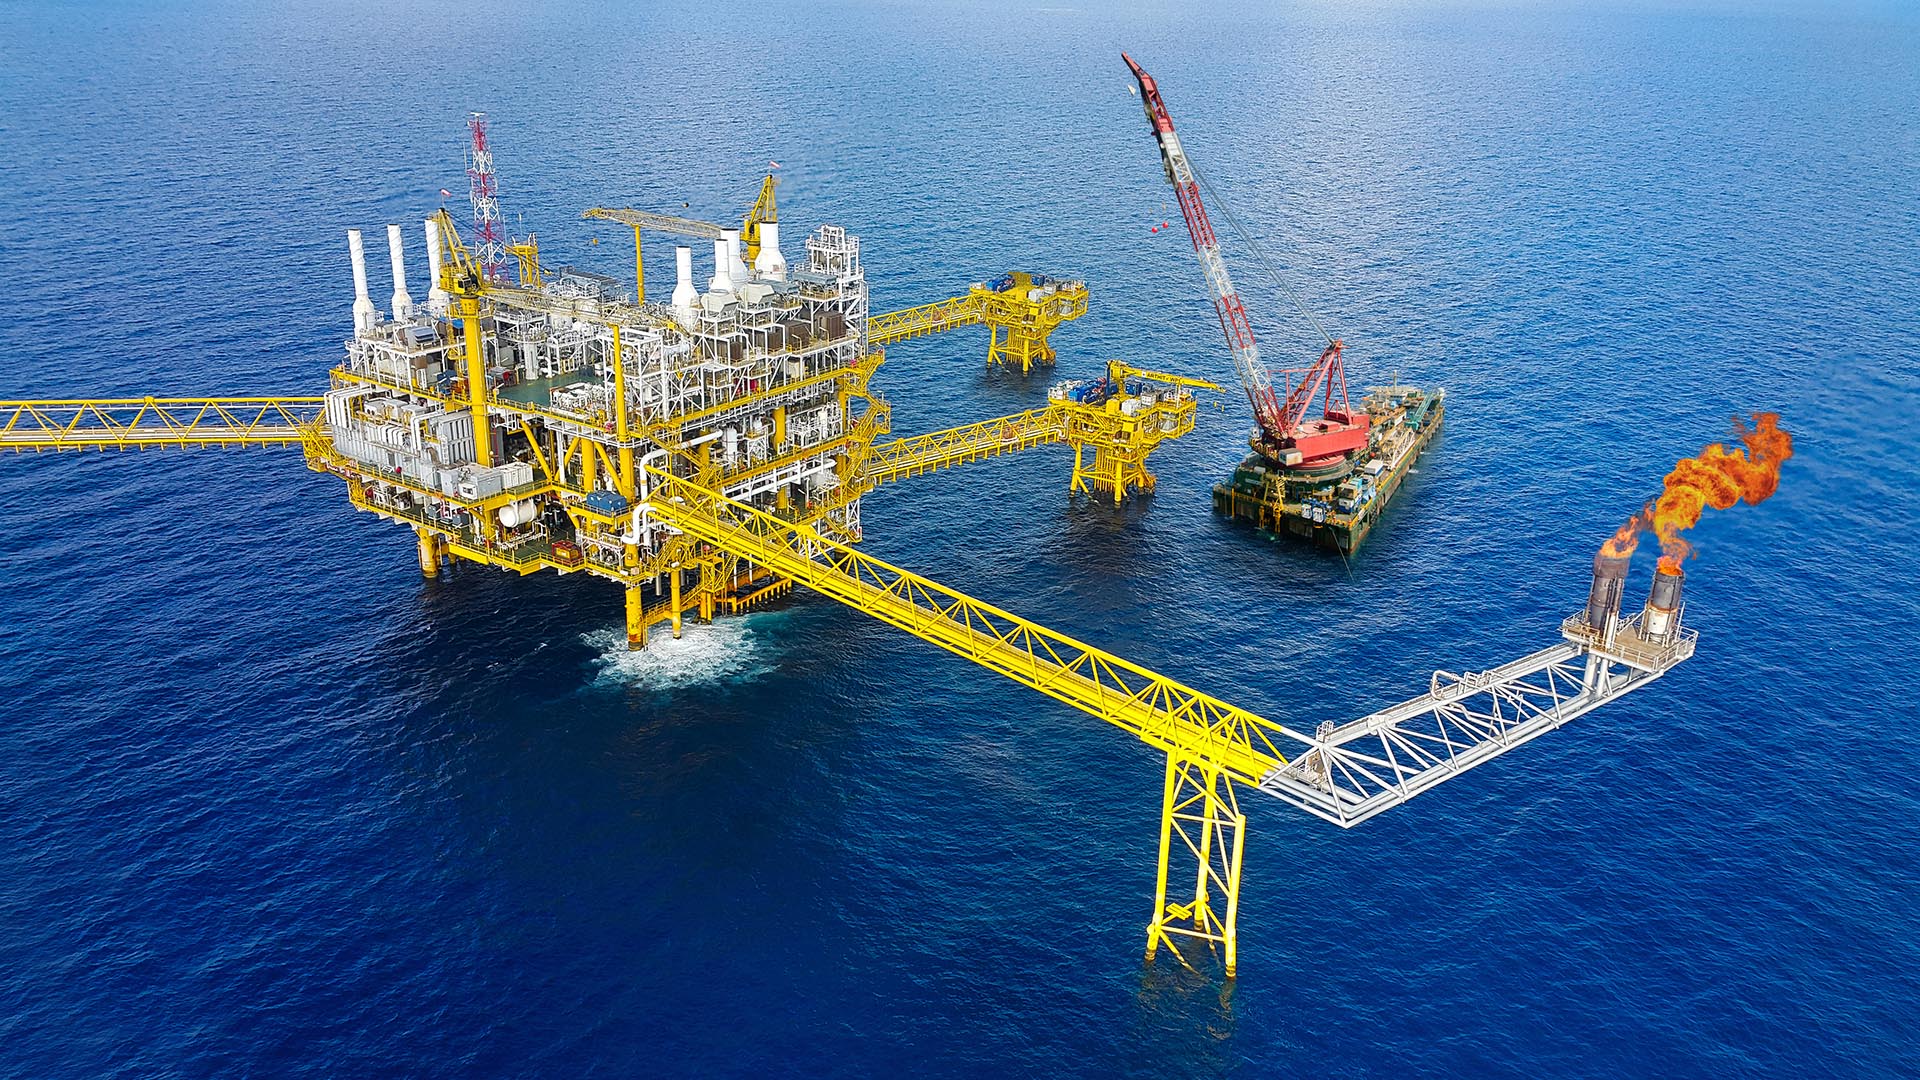
Our client operates in the deepwater oil field in offshore East Malaysia, build in 2007, it is the first and largest deepwater in Malaysia and Asia, as it has a production capacity of 120,000 b/d of oil and a storage capacity of 2 MMbbl.

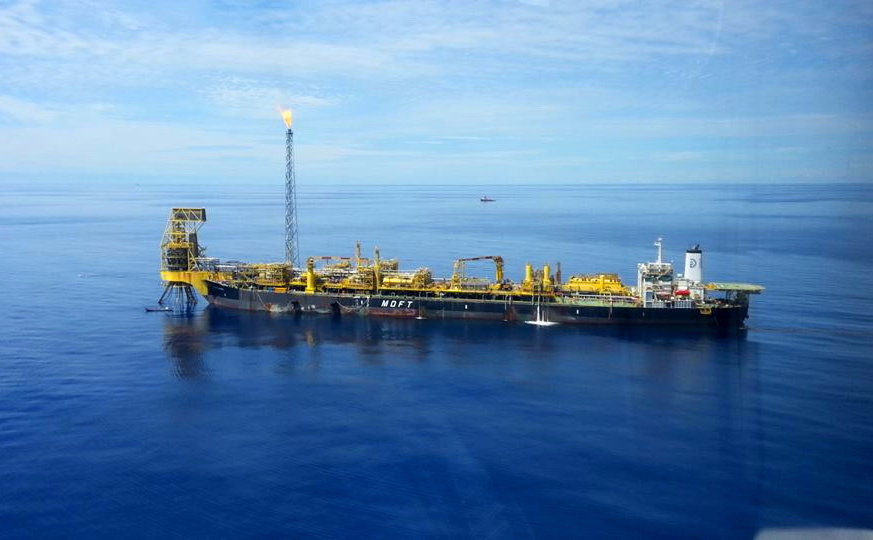
Our client operates in the deepwater oil field in offshore East Malaysia, build in 2007, it is the first and largest deepwater in Malaysia and Asia, as it has a production capacity of 120,000 b/d of oil and a storage capacity of 2 MMbbl.
Their data is manually keyed into Excel using information gathered with PCS7 system located offshore. The spreadsheet is then manually sent by email to the Central Region office for reporting/analysis.
All data and Pi data are segregated in email. There’s no single platform to consolidate all data and it could not be accessible to all levels of operations. So, the client and their management in the central region are desired to have access to the information refreshed at least at a daily rate automatically from the data acquired through OSIsoft PI in Monaco HQ.
A production dashboard with YNY GoDigital solution was proposed in order to allow our client and their management to have:
The dashboard will be designed for production monitoring and machine status monitoring as well as integrating data from OSIsoft Pi. The main objective is to deliver data from offshore processed directly to their central region office, as the data will then be exported as an excel email attachment which will be stored on the database.
With our experts, a production dashboard with Intelligence has been created both at the central region office and available online to integrate different data sources. It is to ease the team with drill down capability to tabulate production summary, equipment status (with KPI), which then can be used for report analysis daily.